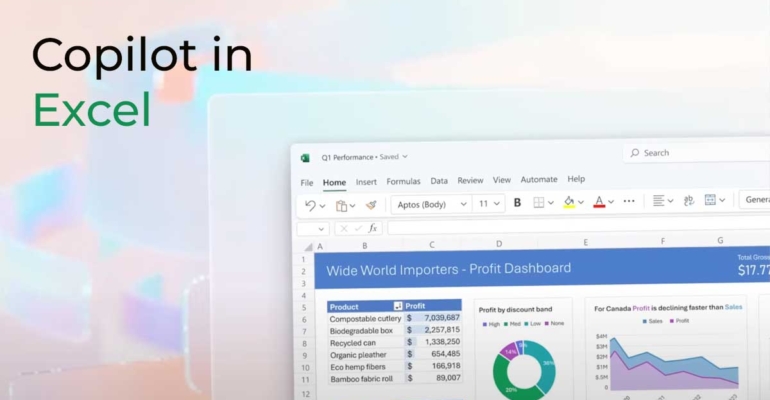
Copilot in Excel: A powerful tool to help you get more done

Copilot in Excel: A powerful tool to help you get more done
Copilot is a powerful new tool in Excel that can help you get more done with your data. It uses machine learning to help you find insights, generate formulas, and create visualizations.
To use Copilot, simply select the Copilot button in the Excel ribbon. This will open the Copilot pane, where you can ask questions and get help with your tasks.
Here are some examples of how you can use Copilot in Excel:
- Find insights: Copilot can help you find insights in your data that you might not have noticed on your own. For example, you can ask Copilot to find the top 10 sales regions or the products that are most likely to be purchased together.
- Generate formulas: Copilot can help you generate formulas to automate your data analysis. For example, you can ask Copilot to create a formula to calculate the average sales per month or the profit margin for a product.
- Create visualizations: Copilot can help you create visualizations to communicate your findings to others. For example, you can ask Copilot to create a chart to show the sales trend over time or a map to show the sales by region.
Copilot is a powerful tool that can help you save time and get more done with your data. Here are some tips for using Copilot effectively:
- Be specific in your questions. The more specific your question is, the better Copilot will be able to understand what you are looking for.
- Use natural language. You don’t need to learn any special syntax to use Copilot. You can simply ask your questions in natural language.
- Experiment with different ways of asking questions. If Copilot doesn’t understand your question, try rephrasing it or asking a different question.
- Use the Copilot documentation. The Copilot documentation provides more information on how to use Copilot and examples of how to use Copilot for common tasks.
If you haven’t tried Copilot yet, I encourage you to give it a try. You may be surprised at how helpful it can be.
Search
Popular posts
- OpenAI o3 batte tutti i record: Un passo decisivo verso l’Intelligenza Artificiale Generale?
- Generative AI: Un Cambiamento Epocale per la Produttività Aziendale
- Analisi dei dati: consigli pratici e reali per un successo sul campo
- L’importanza dell’API Gateway nelle architetture moderne
- Come costruire un dataset di addestramento: guida pratica e riflessioni

Popular tags
AIethics
APIGateway
AWS
BenessereMentale
CareerTips
CloudComputing
CompetenzeDigitali
Copilot
CrescitaPersonale
CrescitaProfessionale
DataScience
Dataset
Event
Excel
GarryKasparov
GestioneDati
GestioneProgetti
GestioneStress
info
Innovazione
IntelligenzaArtificiale
Lavoro
Leadership
MachineLearning
Microservices
Microsoft
Mindfulness
news
Produttività
ProjectManagement
Public Sector Symposium
PublicSpeaking
Python
SaluteMentale
SoftwareArchitecture
Strategia
StressManagement
Tattica
TeamBuilding
Teamwork
TechInsights
TecnicheDiRilassamento
TecnologiaAvanzata
Tool
YouTubeContent

